Ranking · United States
Healthiest peanut bars
The 20 best-scoring peanut bars products sold in the US, ranked by GoodSwap score. Every score comes with a receipt, and brands can’t pay for a place.
Catalog of Oct 11, 2026 · score v1.3.0 · kb 2026.10.11 · How this ranking works
Ranked by score
-
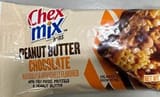 Peanut butter chocolate Chex Mix No additives Score 95 out of 100 Excellent
 -
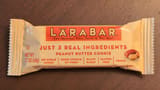 Peanut Butter Cookie Larabar · 1 Bar / 1.7 oz (48 g) High in sugarNo additives Score 74 out of 100 Good
 -
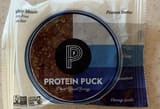 Protein Puck Mighty Moxie · 92 g Contains added sugarsContains seed oilsNo additives Score 69 out of 100 Good
 -
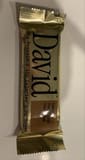 Salted Peanut Butter Flavored Bar David · 2.19 oz Ultra-processedContains non-nutritive sweetenersContains sugar alcohols Score 52 out of 100 Okay
 -
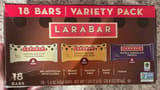 Variety Pack - Chocolate Chip Cookie Dough, Peanut Butter Chocolate Chip, Double Chocolate Truffle Larabar · 816 g High in sugarHigh in saturated fatContains added sugars Score 44 out of 100 Okay
 -
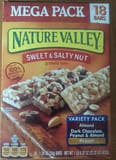 Sweet & Salty Nut Variety Pack Nature Valley · 18 Ultra-processedContains added sugarsContains seed oils Score 28 out of 100 Poor
 -
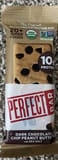 Dark chocolate chip peanut butter with sea walk Perfect Bar · 48 g High in sugarHigh in saturated fatContains added sugars Score 22 out of 100 Poor
 -
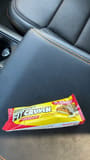 Fit Crunch Chocolate Peanut Butter Chef Robert Irvine's · 1.62 oz (46 g) Ultra-processedContains non-nutritive sweetenersContains added sugars Score 21 out of 100 Poor
 -
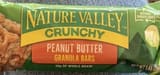 Peanut Butter Granola Bars Nature Valley Crunchy · 1.5 oz (42 g) Ultra-processedHigh in sugarContains added sugars Score 20 out of 100 Poor
 - Peanut brittle Softer Than Brittle · 6 oz/170 g Ultra-processedHigh in sugarContains added sugars Score 16 out of 100 Bad
-
 ClifBar Crunchy Peanut Butter Clif · 2.40 oz Ultra-processedHigh in sugarContains added sugars Score 15 out of 100 Bad
 -
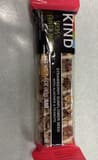 Seeds Fruit & Nuts Kind · 4 oz Ultra-processedHigh in saturated fatContains added sugars Score 15 out of 100 Bad
 -
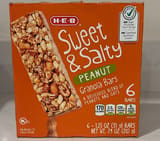 Sweet & salty peanut granola bars H-E-B · 6 - 1.23 oz (35 g) Bars, Net Wt. 7.4 oz Ultra-processedHigh in sugarHigh in saturated fat Score 13 out of 100 Bad
 -
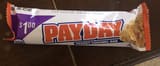 Payday, 1.85 oz Hershey's · 1.85 oz Ultra-processedHigh in sugarContains added sugars Score 12 out of 100 Bad
 -
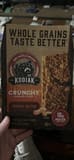 Crunchy Granola Bars Peanut Butter Kodiak · 9.5 oz (270 g) - 6 2-bar pouches 1.59 oz (45 g) Ultra-processedHigh in sugarContains added sugars Score 11 out of 100 Bad
 - Powerbar, pure & simple long lasting harvest energy bar, roasted peanut butter Powerbar · 1.15 lb/525 g Ultra-processedHigh in sugarContains added sugars Score 11 out of 100 Bad
-
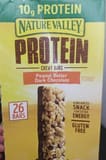 Peanut Butter Dark Chocolate Protein Chewy Bar Nature Valley · 1.04 kg Ultra-processedHigh in saturated fatContains added sugars Score 9 out of 100 Bad
 -
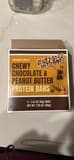 Chewy Chocolate & Peanut Butter Protein Bars Trader Joe's · 7.05 oz (200 g) Ultra-processedHigh in saturated fatContains added sugars Score 6 out of 100 Bad
 -
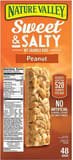 Sweet and Salty Granola Bars Peanut Nature Valley · 57.6 oz Ultra-processedHigh in saturated fatContains added sugars Score 5 out of 100 Bad
 -
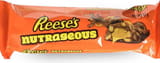 Nutrageous Reese's · 47 g Ultra-processedHigh in sugarHigh in saturated fat Score 1 out of 100 Bad
Most-scanned peanut bars
How the peanut bars products people scan most often in the US compare, most scanned first.
How this ranking works
Products are ordered by their GoodSwap score, the same 0–100 score and receipt the app shows: ingredients, processing and nutrition, with every point tied to a source. Only products sold in the US whose score has medium or high confidence are ranked, and a tie goes to the more-scanned product. A score can change when a recipe or our published method changes; each product page shows the versions behind its number.